Interpretation
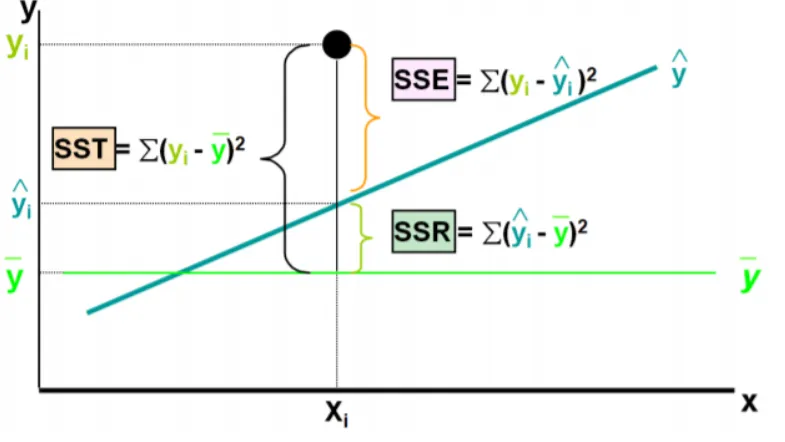
Sum of squares error (SSE)
Variability in unexplained by the regression model.
Recall residual is deviation between predicted and actual values.
It measures the variability that the model does not explain by comparing the predicted and actual values.
Sum of squares regression (SSR)
Variability in explained by the regression model.
This comparison to the mean allows us to measure how much the model’s predictions differ from a baseline prediction (the mean), reflecting the model’s ability to capture patterns in the data.
It’s called Regression Sum of Squares because it quantifies the portion of total variance in the data that the regression model (as opposed to just using the mean) can explain.
Without a regression model: If we had no regression model, the best prediction for any point would simply be
With a regression model: The model generates predictions that (hopefully) is better than just using the mean. measures how much of the variation away from the mean is explained by the model
Sum of squares total (SST)
The equation then reflects the total/full variability of the data. It can be interpreted as combined “explained” and “unexplained” variability in the data.
Without a model, the would be our best predictor, and SST would capture how much the actual data varies from this baseline prediction. This interpretation positions SST as the total amount of “information” or variability in the data that we hope to explain with our regression model.
Mean square error (MSE)
is often used to measure the quality of an estimator. It is actually the variance of the error/residual.
Another measurement is , which is computed by taking the square root of . It is analogous to the standard deviation, and is also known as standard error.